SEO Metrics Explained: Which Ones To Track & How To Use Them (2026 Update)
Daniel Trick
Feb 12, 2026
7 min read

To measure the success of your SEO campaign, you’ll need to track a variety of metrics. These allow you to keep tabs on your progress and determine what aspects of your strategy are working and what aren’t.
To be successful, you need to know which key metrics to consider, identify those applicable to your business, and track SEO progress using them – using only one SEO metric won’t give you a full picture.
SEO metrics, however, can sometimes be a little confusing. For starters, there are so many to get your head around. Plus, today, there are also countless tools and methods that you could use to track them.
In this updated guide to SEO metrics for 2026, we will:
- Explain what SEO metrics are
- Introduce you to the various metrics you might want to include in your SEO strategy
- Discover the tools you can use to measure them
- Discuss AI Visibility Metrics and how to track your brand in ChatGPT, Gemini, and AI Overviews.
We cover both free and paid SEO metrics, and at the end of this article, you will better understand why metric tracking is necessary for SEO, how to track SEO progress, and how it can help your business improve its visibility in the age of AI search.
What Are SEO Metrics?
But before any of that, we need to define what an SEO metric is in the context of SEO.
You can think of an SEO metric as:
Any variable that captures a piece of data relevant to the performance of your pages in search engine results.
SEO metrics should be granular and serve as an indicator of your marketing campaigns’ success. Tracking SEO metrics is an essential part of your SEO strategy because it allows you to determine whether your current marketing efforts are working.
Doing so correctly helps you adapt to changing circumstances – such as the rise of Search Generative Experience (SGE) and AI overviews – making it easier to maintain the effectiveness of your campaigns over time.
Measuring your SEO efforts with metrics brings a host of benefits including:
- Use your marketing budget more wisely
- Attract more qualified leads to your webpages
- Correct problems with your current SEO strategy
- Develop more relevant content for your audience (and for AI models)
- Discover how your competitors are ranking and adopt similar strategies
- Improve the length of time that people spend on your pages
- Reduce the cost of obtaining page clicks from search engine results
- Enhance your page experience (Core Web Vitals)
AI Visibility Metrics (The GEO Era)
New for 2026: Traditional rank tracking is no longer enough. With users turning to platforms like ChatGPT, Claude, and Gemini for answers, you need to track your Generative Engine Optimization (GEO) performance.
These metrics measure how “visible” and “trusted” your brand is within AI-generated responses.
Share of Model (SoM)
Think of this as the AI version of “Share of Voice.” It measures how often your brand appears in AI-generated responses for your target prompts compared to your competitors.
Why it matters: If an AI answers a user’s question directly, you want your brand to be the recommended solution.
Tools to use: LLM Refs, Waikay, or SE Ranking’s AI Search Toolkit.
AI Citations
An AI citation is when a Large Language Model (LLM) explicitly references your URL as a source of information.
Why it matters: Citations are the “backlinks” of the AI world. They signal to the user (and the model) that your content is the authoritative source of truth.
Tools to use: Ahrefs Brand Radar or Perplexity (manual checks).
Sentiment Analysis
It’s not enough to just be mentioned; you need to know how you are being mentioned. Is the AI describing your product as “expensive but high quality” or “outdated”?
Why it matters: AI models influence buyer perception. Tracking sentiment allows you to spot reputation issues early.
How to track: Run your brand through sentiment analysis tools like Brand Skeptic GPT to uncover blind spots in your reputation.
Correctness Score
AI “hallucinations” happen. This metric tracks how accurately AI models describe your products or services.
Why it matters: If ChatGPT tells users your store is closed on weekends when it isn’t, you lose business.
Action: If you find low correctness scores, you need to update your website’s structured data and entity information to “feed” the models better data.
Domain Authority Metrics
Google ranks pages based on the level of trust and “Authority” it perceives the webpage to have. So how do you know if your website is ‘trusted’? With various Authority and Domain Metrics.
Note that all the metrics measured below are calculated differently by different tools. They’re not quite calculating the same thing. You can use them all together to get a comprehensive idea of your site’s health and performance, but don’t be too surprised if there are discrepanices between different tool scores.
Domain Authority (Moz)
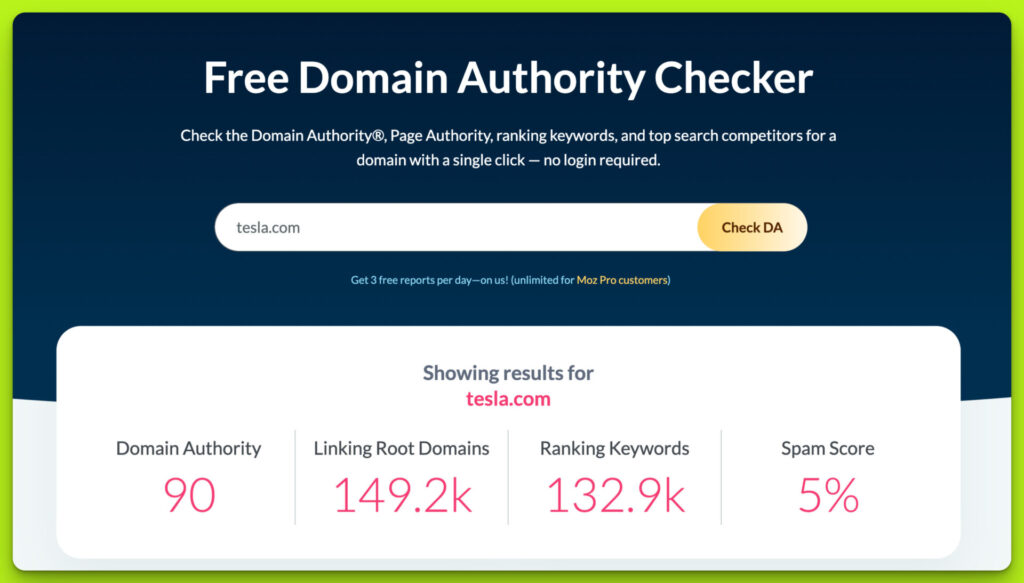
Domain Authority (DA) is a metric created by Moz to measure how likely it is for a website to rank in the search engine results. Moz scores domains on a scale running from 1 to 100, with high DAs representing a greater chance to rank.
How Is Domain Authority Measured?
Moz calculates Domain Authority using multiple factors including the number of linking root domains and the total number of links. It uses a machine learning model to predict how often Google uses that domain in its search results.
Google does not use DA as a ranking metric directly. However, it is essential for checking your own site’s relative ranking strength against competitors.
Domain Rating (Ahrefs)
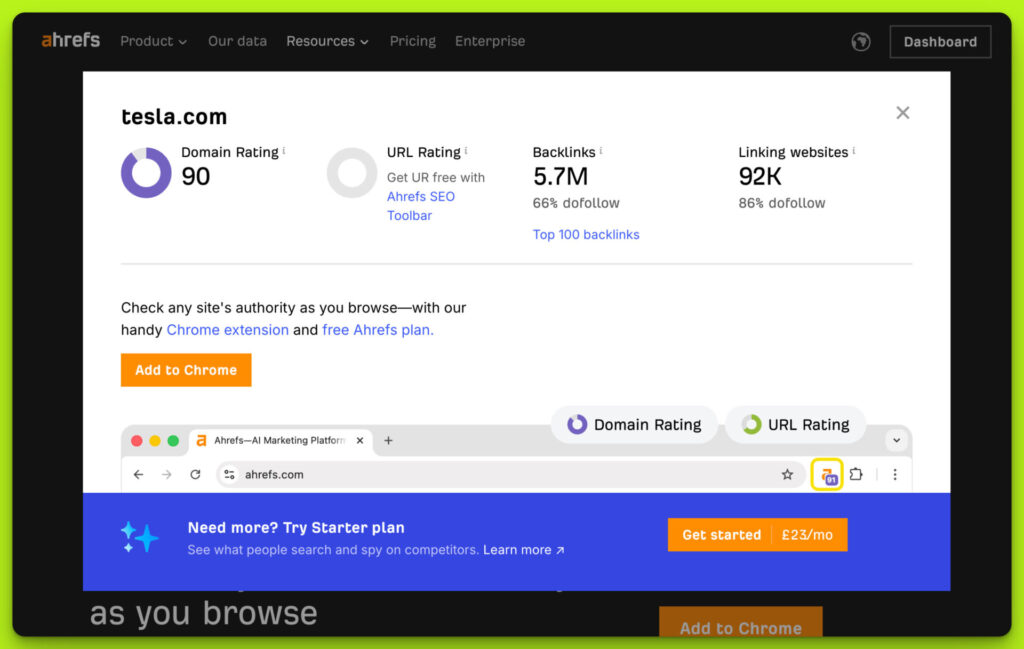
Domain Rating (DR) is Ahrefs’ proprietary metric for showing the strength of a website’s overall backlink profile. As with DA, it measures authority on a logarithmic scale from 0 to 100.
DR is helpful because it helps you judge the “link juice” potential of a backlink. Getting links from relevant sites with high DRs generally improves your ranking more than those with low DRs.
Trust Flow (Majestic)
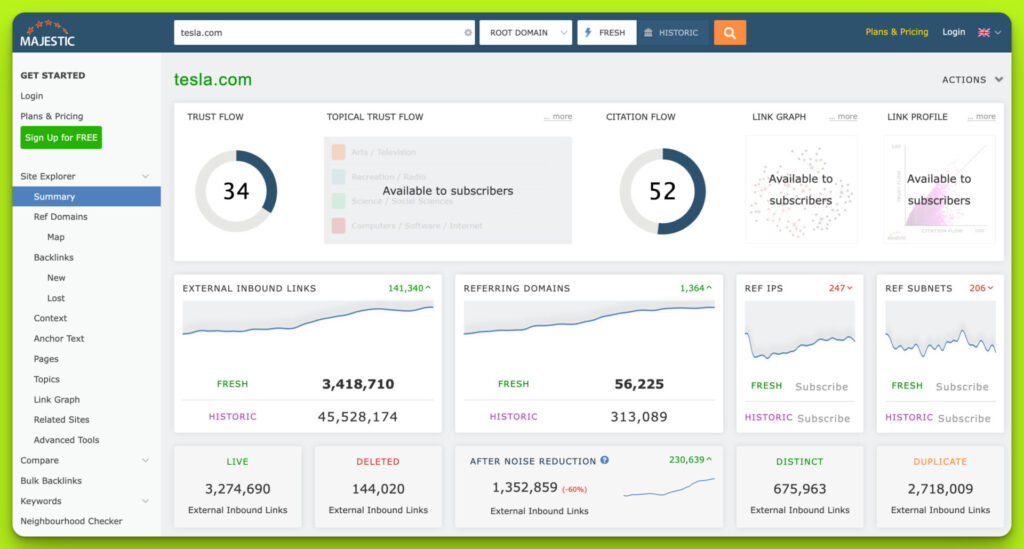
Trust Flow is a proprietary metric from Majestic that captures your website’s “trustworthiness” on a scale of 0 to 100.
Trust Flow is excellent for spotting spam. If a site has a high citation flow (lots of links) but a low Trust Flow, it likely has a low-quality or spammy link profile.
Authority Score (Semrush)
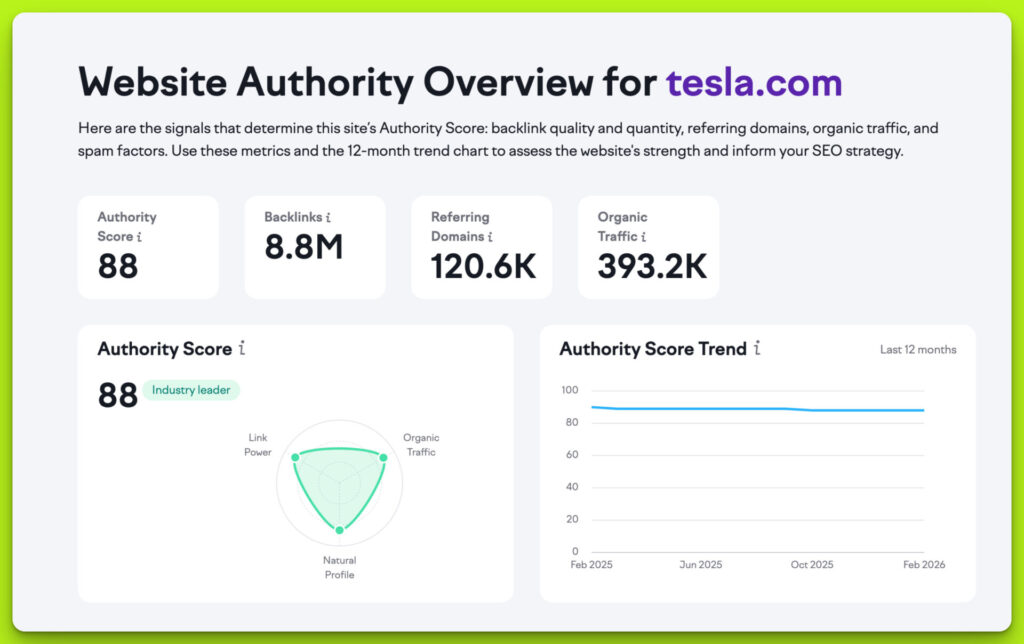
Semrush’s Authority Score (AS) is a compound metric used to measure the overall quality of a domain or webpage. It considers link power, organic traffic, and spam factors (indicators of link manipulation).
Webpage Authority Metrics
Page Authority (Moz)
PA, also from Moz, is similar to DA, but it is used to measure the authority of a single page rather than the entire domain.
Use PA to determine which individual pages on your site (or a competitor’s site) are the strongest. If you are trying to outrank a specific competitor article, check their PA. If it’s high, you will need more backlinks and better content to compete.
Keyword Research Metrics
Search Volume
Search volume is the number of times a specific keyword is searched for in a given timeframe (usually monthly).
2026 Update: While volume is important, “Zero-Click” searches are on the rise due to AI Overviews. A keyword might have high volume, but if AI answers the question directly on the results page, you might get less traffic than expected. This makes tracking AI Visibility (see above) just as important as volume.
Keyword Difficulty (KD)
Keyword Difficulty estimates how hard it would be to rank on the first page of Google for a given keyword. Most tools (Ahrefs, Semrush, Moz) use the backlink profiles of the current top 10 results to calculate this.
Traffic SEO Metrics
In 2026, we primarily use Google Analytics 4 (GA4) as the source of truth for web traffic, though it does have its visibility limitations.
Organic Traffic & AI Referral Traffic
This is the number of visitors arriving at your website from search results.
Classic Organic: Visitors from Google/Bing search results.
AI Referrals: In GA4, watch for traffic sources like chatgpt / referral, bing / organic (often Copilot), or perplexity. You need to segment these to understand if users are clicking through from AI chats.
Engagement Rate (Replacing Bounce Rate)
In the past, we obsessed over Bounce Rate (the percentage of people who left after one page). In GA4, this has been largely replaced by Engagement Rate.
What is an “Engaged Session”?
A session is considered “engaged” if it meets one of these criteria:
- Lasts longer than 10 seconds
- Has a conversion event
- Has 2 or more pageviews
Why Measure Engagement Rate?
It is a more positive and accurate way to view user behavior. A low engagement rate means users aren’t finding what they need. A high rate signals quality content that matches search intent.
Technical SEO Metrics
Technical SEO is more vital than ever. Google’s Core Web Vitals are a confirmed ranking factor.
Core Web Vitals (2026 Updated)
Google uses these metrics to measure the “Page Experience” of your site.
Largest Contentful Paint (LCP): Measures loading performance. To provide a good user experience, LCP should occur within 2.5 seconds of when the page first starts loading.
Interaction to Next Paint (INP): Replaced FID in 2024. INP measures responsiveness. It assesses how quickly a page responds to user interactions (clicks, taps, key presses). A good INP is under 200 milliseconds.
Cumulative Layout Shift (CLS): Measures visual stability. A good CLS score is less than 0.1.
How to Track:
Use the Core Web Vitals report in Google Search Console or the PageSpeed Insights tool.
Mobile Metrics
Mobile-friendliness is no longer optional; it’s the default. Google uses Mobile-First Indexing for all websites.
Metric to watch: Compare your Engagement Rate on Mobile vs. Desktop. If mobile engagement is significantly lower, your site likely has mobile usability issues that are hurting your rankings.
SEO Metrics – What Really Matters In 2026?
Tracking SEO metrics in 2026 requires looking beyond just “rankings.” With the introduction of AI-driven results and more complex user behavior models, you need to focus on Authority (DA/DR), User Experience (Core Web Vitals/INP), Engagement (GA4), and AI Visibility (SoM/Citations).
Don’t get hung up on a single number. Use these metrics together to build a complete picture of your website’s health and performance.
Become a Pro at SEO
Join 65,000 others and learn the secrets to SEO success with our weekly blog posts.